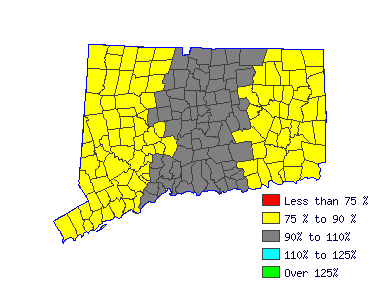
| Mean Wage History |
| Year | This Occupation | Compared to
Occupational Group | Difference |
| Current | $94457.28 | | $59318.19 |
| $35139.09 |
| 2014 | $93998.01 | +.5% | $59029.77 |
+.5% | $34968.24 |
| 2013 | $92237.46 | +1.9% | $57924.16 |
+1.9% | $34313.29 |
| 2012 | $90476.91 | +1.9% | $56818.56 |
+1.9% | $33658.35 |
| 2011 | $88716.36 | +2.0% | $55712.95 |
+2.0% | $33003.41 |
| 2010 | $87338.54 | +1.6% | $54847.69 |
+1.6% | $32490.84 |
| 2009 | $85807.63 | +1.8% | $53886.30 |
+1.8% | $31921.33 |
| 2008 | $84889.08 | +1.1% | $53309.46 |
+1.1% | $31579.62 |
| 2007 | $82363.07 | +3.1% | $51723.15 |
+3.1% | $30639.92 |
| 2006 | $79607.43 | +3.5% | $49992.64 |
+3.5% | $29614.79 |
| Year | This Occupation | Compared to
All Occupations | Difference |
| Current | $94457.28 | | $56151.41 |
| $38305.87 |
| 2014 | $93998.01 | +.5% | $55693.41 |
+.8% | $38304.60 |
| 2013 | $92237.46 | +1.9% | $54502.59 |
+2.2% | $37734.87 |
| 2012 | $90476.91 | +1.9% | $53403.38 |
+2.1% | $37073.53 |
| 2011 | $88716.36 | +2.0% | $52487.37 |
+1.7% | $36228.99 |
| 2010 | $87338.54 | +1.6% | $51662.96 |
+1.6% | $35675.58 |
| 2009 | $85807.63 | +1.8% | $50792.75 |
+1.7% | $35014.87 |
| 2008 | $84889.08 | +1.1% | $50105.74 |
+1.4% | $34783.33 |
| 2007 | $82363.07 | +3.1% | $48823.33 |
+2.6% | $33539.74 |
| 2006 | $79607.43 | +3.5% | $47266.11 |
+3.3% | $32341.32 |
|
Reference Date: 1st Quarter 2015 |
State of Connecticut Department of Labor Office of Research
200 Folly Brook Boulevard Wethersfield, CT 06109
Phone: 860-263-6285 |

| | | | |
| Top Areas For This Occupation |
|
|
|
 |


